Project Overview
This project demonstrates how to use AI to analyze and visualize forestry data. By leveraging advanced AI capabilities, we can extract insights from complex datasets that might be difficult to identify through traditional analysis methods, transforming raw data into intuitive visualizations that aid in decision-making for forest management professionals.
The power of AI-enhanced visualization lies in its ability to identify patterns across multiple variables simultaneously, revealing relationships that might otherwise remain hidden in traditional forestry reports and spreadsheets.
Approach & Methodology
This project follows a systematic approach to forestry data visualization:
- Data Collection: Utilizing public forestry data from BC government sources, focusing on growth patterns, species distribution, and environmental factors.
- Data Preprocessing: Cleaning and organizing datasets to ensure consistency and compatibility with AI analysis tools.
- Prompt Engineering: Creating effective prompts for AI models to analyze the data and identify meaningful patterns.
- Visualization Development: Transforming AI insights into clear, actionable visual representations.
- Validation & Refinement: Testing visualizations with forestry professionals to ensure practical utility.

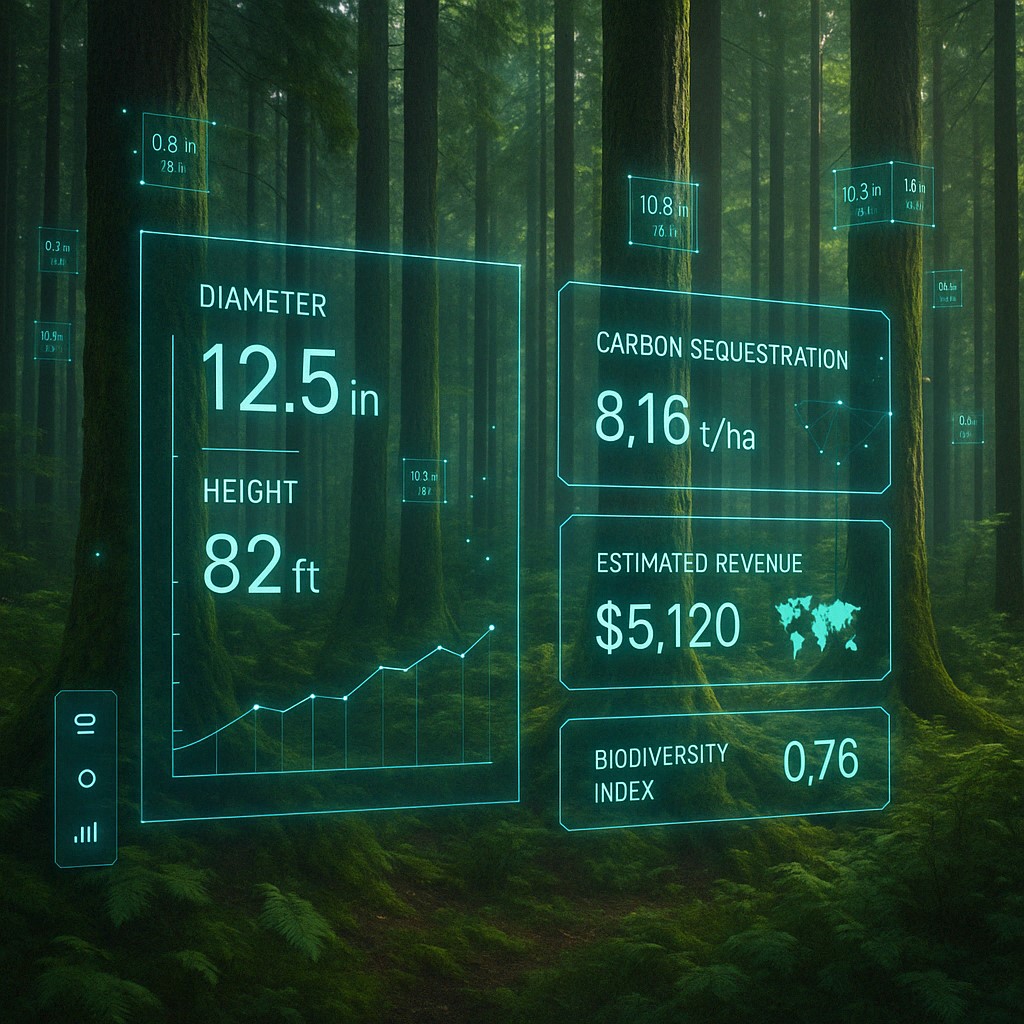
Interactive dashboard combining multiple visualization types to provide comprehensive forest stand analysis.
Key Findings & Innovations
The AI-powered visualization approach revealed several key insights:
- Hydrological Correlations: AI analysis identified previously unrecognized correlations between tree growth patterns and local hydrology, showing how subtle water table variations influence forest development.
- Species Interaction Patterns: Visualizations revealed complex relationships between different tree species in mixed stands, highlighting competition and facilitation dynamics.
- Temporal Patterns: Multi-variable analysis uncovered seasonal growth patterns not obvious in traditional reports, particularly regarding climate adaptation responses.
- Management Impact Visualization: Created intuitive before/after comparisons of different management approaches, making complex data accessible to stakeholders.
Example Analysis & Visualization Techniques
The project employed several innovative visualization approaches:

Multi-variable tree growth visualization showing correlations between soil moisture, species, and growth rates.
Below is a sample prompt used to analyze forestry data with AI:
I have a dataset of tree measurements from a mixed-species stand in coastal British Columbia.
The dataset includes:
- species (Douglas-fir, Western Hemlock, Western Redcedar)
- DBH (diameter at breast height, in cm)
- height (in meters)
- crown width (in meters)
- soil moisture level (1-5 scale)
Please analyze this data to identify:
1. Correlations between tree size measurements and soil moisture
2. Species-specific growth patterns
3. Potential visualization approaches that would effectively communicate these patterns
4. Recommendations for further data collection to enhance the analysis
Implementation Techniques
The visualizations were created using a combination of tools and techniques:
- Interactive Time-Series Analysis: Dynamic visualizations showing forest change over time, with the ability to adjust variables and see immediate effects.
- Geospatial Mapping: Heat maps overlaid on topographical data to show the spatial distribution of key variables.
- 3D Stand Visualization: Three-dimensional renderings of forest stands based on inventory data, allowing virtual "walk-throughs" of different management scenarios.
- Correlation Networks: Visual networks showing relationships between different variables, with line thickness indicating correlation strength.
- Prediction Modeling: Visual forecasts of forest development under different management and climate scenarios.
Future Directions
This approach shows significant promise for enhancing forestry data communication. Next steps include:
- Expanding the analysis to include climate change impact data, visualizing potential adaptation strategies
- Creating more interactive visualizations for educational and stakeholder engagement purposes
- Integrating multiple data sources for comprehensive ecosystem modeling and visualization
- Developing standardized visualization templates that can be easily adapted by forestry professionals
- Creating mobile-friendly visualization tools for field use in forest management
By continuing to refine these visualization techniques, we can bridge the gap between complex forestry data and practical decision-making, ultimately improving sustainable forest management practices.